
 Industrial component wholesaler W.W. Grainger (GWW), with 46 consecutive years of rising dividends, is one of the venerable dividend aristocrats.
Even more impressive is that Grainger has rewarded long-term dividend investors with impressive 11.5% annual dividend growth over the last three decades.
Let’s take a closer look at this dividend aristocrat to see whether or not it can continued its long-term double-digit dividend growth in the face of increasing competition from emerging rivals such as Amazon (AMZN).
As importantly, learn whether or not Grainger could be a valuable long-term investment or a value trap with its dividend yield near its all-time high.
Business Overview
Founded in 1927 in Lake Forest, Illinois, W.W Grainger is North America’s largest maintenance, repair, and operator (MRO) parts distributor.
Its 5,100 global suppliers provide the company with about 1.6 million products (e.g. material handling equipment, safety and security supplies, lighting and electrical products, power tools, pumps and plumbing supplies, cleaning and maintenance supplies, building and home inspection supplies, vehicle and fleet components), as well as inventory management systems to more than 3.2 million business, government, and institutional customers around the world.

Source: 2017 Company Factsheet
Grainger operates both through online, e-commerce channels (65% of 2016 sales), as well as nearly 600 global physical stores as of the end of 2016.
Business Analysis
The key to Grainger’s success over the past decades has been its large network effects and massive economies of scale.
Specifically, the company’s massive supply chain and large global distribution network allowed it to become a “one-stop shop” that customers, both large and small, could depend on for reliable, just-in-time delivery of critical components needed to operate their businesses.
With the largest network of distribution centers and store branches in the country, Grainger is strategically positioned with localized inventory that is close to its most important customers.
Being in close proximity to customers helps Grainger deliver products to them very quickly, offer a high quality of service, and keep costs low. Competitors would need to acquire properties in the same service area to compete with Grainger, but they wouldn’t have the established book of business to cover all of their costs.
The mature state of the MRO market makes it very difficult for new players to crack into a geography already covered by a capable distributor, somewhat limiting competition.
Grainger’s scale and inventory assortment are also advantages, especially in the large customer market.
As the largest player in North America, Grainger has somewhat better purchasing power than local or regional distributors. This allows it to offer very competitive pricing for its products, which are generally undifferentiated from one distributor to the next.
Importantly, Grainger’s size also enables it to afford an extremely broad selection of merchandise, making it a one-stop shop for large accounts that are constantly looking to save money by consolidating suppliers.
Grainger’s U.S. catalog offering has grown more than seven-fold from 82,000 SKUs in 2005 to well over half a million SKUs in the latest edition. Impressively, the time a product is in stock has remained at nearly 100% even while increasing the product line substantially.
With thousands of suppliers, this is no small feat. Grainger.com in the U.S. also offers access to more than 1.5 million SKUs.
Simply put, Grainger has historically enjoyed a wide moat, which allowed it operate on a business model that included high markups and volume discounts for its largest and most important customers.
This helped the company enjoy consistent growth, fat margins, high returns on shareholder capital, and strong EPS and free cash flow (FCF) growth.

Source: Simply Safe Dividends
However, in recent years the ground has shifted under Grainger and the entire MRO industry. That’s because Amazon (AMZN) launched its Amazon Supply subsidiary, which directly targeted the $366 billion market in which Grainger operates in.
Amazon doubled down on its efforts to become a large scale business supplier in 2015 by rebranding Amazon Supply into Amazon Business, and the effect on Grainger’s sales and earnings has been negative.
That’s because, as Amazon founder and CEO Jeff Bezos likes to say, “your margin is our opportunity.”
Specifically, Amazon’s highly transparent online pricing model makes it much harder for Grainger to enjoy the kinds of markups it has in the past, which partially explains the company’s declining profitability of late.

Fortunately, Grainger has a long-term plan for competing with Amazon, one that it believes can return the company to profitable long-term growth.

Source: Investor Presentation
Specifically, Grainger is moving towards a more transparent pricing model, with less emphasis on large-scale markups and preferential discounts for large customer contracts.
In essence, Grainger is now attempting to more directly compete on price with Amazon and its other rivals.
In fact, while management had planned on gradually phasing in these price cuts through 2018, it recently decided to pull forward those cuts into the next few quarters. The news resulted in a big earnings miss and reduced guidance in a quarterly earnings report earlier this year.
However, the good news is that, while these price reductions are painful in the short-term, they should help Grainger achieve its goal of winning market share.
For example, after reducing its prices, U.S. large scale volumes increased 9%, and Grainger’s growing emphasis on selling products to medium-sized U.S. businesses via its online sales channels has resulted in strong volume increases.

In fact, Grainger is investing heavily into expanding its new Gamut online sales channel, and its recent success has now made the company the nation’s 10th largest e-commerce seller.
Of course, winning market share is easy if you just cut prices. So Grainger’s turnaround plan is also focused on leveraging its fast-growing e-commerce platform into one that better communicates with customers in real-time and attempts to build a sticky ecosystem through a greater emphasis on services, especially supply chain management.
Meanwhile, in order to offset the margin compression that comes with lower prices, Grainger plans to dramatically cut costs by $85 million to $95 million a year by 2019 on its way to a longer-term goal of $100 million to $125 million in cost reductions (around 1% of sales).

This is courtesy of several cost savings measures, including greatly shrinking its physical store count, especially in its underperforming Canadian unit where 59 out of 144 stores are slated to be closed.
The reason this could be a smart idea is because Grainger expects 80% of sales by 2022 to come from its e-commerce platform, meaning that its brick-and-mortar outlets represent high overhead, low-hanging fruit when it comes to being able to maximize its sales at the lowest possible cost.
Combined with greater automation in its distribution centers and larger economies of scale in its supply chain (maximize cost savings with suppliers), Grainger thinks that it can achieve much better margins by 2019, including:
- 15% to 16% operating margins in the U.S., while achieving 8% to 9% volume growth
- 2% to 4% operating margin in its Canadian business (which is currently losing money)
- 8% to 10% operating margins in all other business units
- Company-wide operating margins of 12% to 13%
If Grainger can indeed execute on this turnaround plan, then it will mean not only faster top line growth but also far better margins than it enjoys today.
Trailing 12-Month Profitability

Sources: Morningstar, Gurufocus
However, such a plan requires shareholders to be patient, as short-term sales and earnings growth are likely to be disappointing.
For example, Grainger’s reduced full-year guidance calls for 1% to 4% sales growth (down from 2% to 6%) and 7.9% EPS growth, (down from 20%).
Fortunately, the dividend prospects remain positive, making W.W Grainger a potentially interesting contrarian play for long-term dividend growth investors.
Key Risks
While W.W Grainger has a few things in its favor that should help it compete with major rivals such as Fastenal (FAST), Home Depot (HD), and Amazon, including a greater emphasis on higher margin private label brands (22% of 2016 sales), investors must not underestimate the potential for ongoing margin compression.
Amazon Business is an especially potent potential threat that is attempting to dominate the business-to-business (B2B) industry with a focus on rock bottom prices and supreme customer service (automated order flows, free shipping, and real time order tracking).
In fact, Amazon, which specifically called out Grainger as one of its biggest rivals, has said that the B2B industry is a “top priority,” “must win” industry and is aiming to become the “preferred marketplace for all professional, business, and institutional customers worldwide.”
Unlike some other MRO companies, such as Fastenal, which focus on more premium, custom-built products, Grainger’s business is far more general and commoditized, meaning that it could end up trapped in a race to the bottom on price with Amazon, especially given its focus on large accounts.
Amazon also has a high margin and fast-growing subsidiary, Amazon Web Services (cloud computing), which allows it to generate a vast amount of free cash flow ($8.8 billion in the past 12 months); over 10 times what Grainger produces.
This means that Amazon, which is famous for its long-term, growth above profits focus, can afford to compete with Grainger’s enormous distribution network and potentially even vastly surpass it in time.
The bottom line is that in terms of profitability, which peaked at almost 14% operating margins in 2013, Grainger’s best days are almost certainly behind it.
Management may fail to meet its lofty targets of 12% to 13% company-wide operating margins in 2019 and beyond. In fact, Morningstar’s Brian Bernard thinks that 11% is the best management will be able to achieve in the coming years.
While increased competitive pressures are arguably the biggest threat to Grainger’s long-term earnings power, investors considering the stock should also remain aware that the company’s short-term results are sensitive to the industrial economy, which has struggled in recent years.
From low oil prices to slower growth in China to the strong U.S. dollar, numerous headwinds have impacted ordering trends and resulting in modest pricing pressure at many of Grainger’s customers. When growth is low, price competition can become fiercer between distributors as they look to protect market share and take out costs.
W.W. Grainger’s Dividend Safety
We analyze 25+ years of dividend data and 10+ years of fundamental data to understand the safety and growth prospects of a dividend.
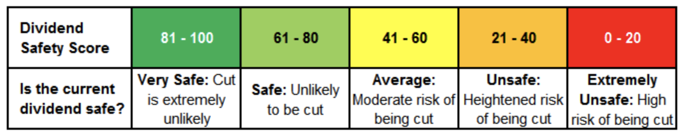
Our Dividend Safety Score answers the question, “Is the current dividend payment safe?” We look at some of the most important financial factors such as current and historical EPS and FCF payout ratios, debt levels, free cash flow generation, industry cyclicality, ROIC trends, and more.
Dividend Safety Scores range from 0 to 100, and conservative dividend investors should stick with firms that score at least 60. Since tracking the data, companies cutting their dividends had an average Dividend Safety Score below 20 at the time of their dividend reduction announcements.
We wrote a detailed analysis reviewing how Dividend Safety Scores are calculated, what their real-time track record has been, and how to use them for your portfolio here.
W.W. Grainger has a Dividend Safety Score of 90, indicating a highly secure and dependable dividend. In fact, Grainger’s dividend has grown each year since 1971.

Grainger’s impressive payout safety and consistent growth is courtesy of three main factors.
First, management has wisely chosen to be highly conservative and disciplined with how quickly it grows the dividend, allowing it to maintain very safe EPS and FCF payout ratios.
Over the last four quarters, Grainger’s dividend has consumed 56% of its earnings and 37% of its free cash flow. As seen below, the company’s payout ratios have increased somewhat over the last decade but have remained fairly stable most years.


By maintaining a FCF payout ratio in the range of 30% to 40%, Grainger ensures that the dividend has a strong safety buffer against potential industry downturns.
In addition, it gives the company increased flexibility to invest in new growth opportunities (such as e-commerce and its turnaround plan), opportunistic acquisitions, as well as steadily reducing the share count over time.

In fact, over the past 20 years, Granger has bought back 48% of its shares, or 3.7% per year. That helps to lower the cost of the dividend (i.e. decrease the payout ratio) and allow for stronger, more sustainable dividend growth over time.
While most industrial-focused businesses do not perform well during recessions, potentially making their dividends riskier over a full economic cycle, Grainger is somewhat of an exception.
That’s because many MRO products are “mission-critical” and needed by businesses regardless of how the economy is doing. If a valuable piece of equipment breaks down, it needs to be fixed.
As a result, Grainger’s sales fell by 9% during fiscal year 2009, and the company’s earnings contracted by just 6%. Not bad for an industrial business. GWW’s stock also outperformed the S&P 500 by approximately 29% in 2008.
Part of Grainger’s solid performance was driven by its cash-rich business model, which has generated extremely predictable free cash flow every single year over the last decade.
Importantly, distributors actually generate more free cash flow during recessions (see the jump in fiscal year 2009 below) because they are able to collect their accounts receivables and liquidate some of their inventory, freeing up cash.
You will also note in our earlier graph of Grainger’s free cash flow payout ratio that the company’s payout ratio dropped from 35% in 2008 to 23% in 2009 as a result. This unique business model characteristic further strengthens the security of Grainger’s dividend.

In addition to Grainger’s consistency and counter-cyclical cash flows, the company’s dividend is also protected by the firm’s strong balance sheet.

Of course, because this is a highly capital intensive industry (due to the high inventory requirements), we need to keep the company’s credit metrics in context by comparing them to its industry peers.
When we do, we see that Grainger benefits from a lower than average leverage ratio, a very strong current ratio (short-term assets/short-term liabilities), and a high interest coverage ratio that explains why it has a very strong investment-grade credit rating.

Sources: Morningstar, Fast Graph
That allows it to borrow very cheaply (3.2% average interest rate) and provides even more financial flexibility to invest in the grow of the business, while still providing dividend lovers a generous and steadily growing payout.
Overall, there’s not much to dislike about the quality of Grainger’s dividend. The company’s payout ratios are very reasonable, it generates counter-cyclical free cash flow, and the balance sheet is healthy. This is one of the most reliable dividends out there.
W.W. Grainger’s Dividend Growth
Our Dividend Growth Score answers the question, “How fast is the dividend likely to grow?” It considers many of the same fundamental factors as the Safety Score but places more weight on growth-centric metrics like sales and earnings growth and payout ratios. Scores of 50 are average, 75 or higher is very good, and 25 or lower is considered weak.
W.W Grainger has a Dividend Growth Score of 73, indicating that dividend investors can likely expect stronger than average dividend growth (relative to the S&P 500’s 20 year payout growth rate of 5.9%).
However, that being said, given the increased competitive pressures on its profitability, Grainger isn’t likely to be able to generate the kind of impressive double-digit dividend increases of the past decades.

Grainger is likely to still be able to generate 4% to 5% long-term sales growth, which combined with an increase in long-term margins would translate to about 4% to 7% annual earnings growth.
When combined with 3% to 4% annual share buybacks, Grainger’s EPS and FCF per share should be able to grow by around 7% to 10% over the long-term, assuming everything goes as management plans (perhaps a big assumption).
Given that Grainger’s current payout ratios offer a good mix of a secure dividend, great financial flexibility, and payout growth, investors should expect Grainger’s dividend to grow at about the same pace as its bottom line, somewhere in the upper single-digits.
Valuation
Over the past year, W.W. Grainger shares have underperformed the S&P 500 by more than 40%, mainly due to concerns over its turnaround plans, shrinking margins, and the rising threat posed by Amazon.
As a result, Grainger’s stock now trades at a meaningful discount to its long-term valuation multiples.
For example, GWW’s forward P/E ratio of 15.6 is not only below the S&P 500’s 17.5, but also below the industry median of 17.0 and far below its historical norm of 19.3. However, keep in mind that this 13-year median P/E is based on a time when margins were both high and growing steadily.
Meanwhile, GWW’s current dividend yield of 3.1% is not just higher than the S&P 500’s 1.9% and the industry median of 2.0%, but also nearly double the stock’s historical norm of 1.6%. In fact, Grainger’s yield is now at an all-time high.
While Grainger’s yield may not be high enough for all investors, such as those needing to live off dividends in retirement, long-term income investors have potential to achieve 10.1% to 13.1% annual total returns (3.1% yield + 7% to 10% annual earnings growth) if management’s plans play out as expected.
Conclusion
While W.W. Grainger may never again be able to enjoy the kind of fat margins it once did, its time-tested, long-term focused management team, strong balance sheet, and industry-leading customer network and relationships will allow the company to continue achieving steady, if slower, dividend growth in the coming years.
With Grainger’s stock slumping by more than 15% since my bearish note in April 2017 about GWW’s valuation risk and the long-term threat posed by Amazon (see here for a deeper understanding of Amazon’s intentions), expectations are starting to look more attractive.
I still don’t believe Amazon is an existential threat to Grainger’s business, but increased price transparency and the continued rise of the online world seem likely to continue making Grainger more of a commodity company over the coming years.
I personally plan to continue avoiding the company until there is greater clarity around Grainger’s attainable long-term margins, but today could admittedly still be a reasonable time for contrarian value investors to take a closer look at this relatively cheap dividend aristocrat, especially given Grainger’s all-time high dividend yield.
Hi Brian,
Great analysis as usual. 40% underperformance vs S&P 500 for a Dividend Aristocrat, a relatively reasonable PE and such high safety and growth scores would suggest this would be a clear buy for you, especially in comparison to some other names in your portfolios. Waiting for stable margins may potentially keep you on the sidelines for many quarters and fat dividends. I’m curious about your reluctance and how you view rebalancing your portfolios? For example, why wouldn’t GWW be a candidate for your top 20 or conservative portfolios given relative value, safety, growth and current all time high yield. I am long GWW so would enjoy hearing more about your cold feet! Many thanks, Doug
I don’t know this company, but reading your article I think that I will buy some shares
Very nice and detailed analysis on GWW. Given the lack of income growth for the past few years, I would hesitate to add to GWW as a long term holding.
The share price may bounce back in the short-run of course. Or it could go down from here.
But without future growth in EPS, future dividend growth and growth in intrinsic value will be very hard to generate. As long-term dividend growth investors, this is what we are after..
DGI